LibreOffice: Two ways to create a chart
You open your document, you create a chart want to insert.
- In LibreOffice Writer, you can find the charts under Insert > object > chart.
- You can use LibreOffice Calc, Impress or Draw, create a chart by clicking on the small Icon (see image).
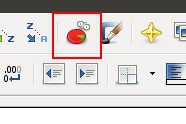
A click created the chart
By clicking on the chart, you make the surface
Once you have created the chart you can change with a click on the area of the Design.
- By double-clicking a window will open - here you can change the line thickness, color, fill, and transparency.
- Right-clicking offers you the selection between diagram types, sizes, and axes.
- Tap the bar with a right click, you can format the data.
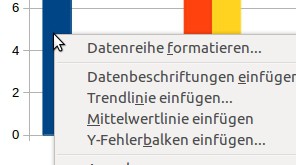
You could format the data
You are finished with the chart, we will show you in a further practical tip, how to use the file, save it as a PDF.


