DebugBar as a Firebug Alternative for Internet Explorer
The next is the Internet Explorer add-on comes DebugBar the model Firebug well. DebugBar is there for Download here and can be simply a Installer install.
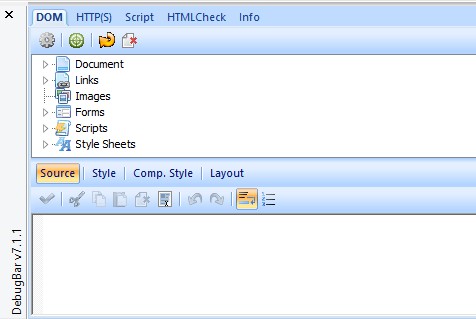
- The DebugBar Toolbar, which appears at the top of the Browser, provides quick access to practical functions such as a color picker, a screenshot function, access to the source code etc. Like all other Toolbars, this one can also easily show and hide.
- The so-called "development Bar" is the part that is highly reminiscent of FireBug. Here, you can debug, for example, Javascript, the HTML-Code to error-check or HTTP(S) Header list. You can also get here is a practical Overview on the Document Object Model (DOM) of the page.
- Nice also the possibility to add Javascript Code on the page is.
Develop with the DebugBar
Native FireBug Alternative Internet Explorer Developer Tools
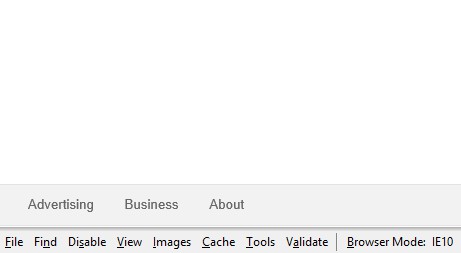
Already the Internet Explorer Developer Tools are installed. To view them, you need to press F12, after which the menu appears. The Developer Tools, see "Tools" - "Developer Tools".
- On the bar that appears at the bottom of, for example, changed the CSS, or be completely disabled. Optionally, you can also disable all images.
- The source code you can view in different versions, for example, as a DOM, or just as an Original.
- As is the case with the DebugBar, you can validate all elements of the site.
- Very convenient for the Internet Explorer: you the considered site can also access modes that the previous versions of Internet Explorer to simulate. The versions differ significantly from each other.
Natives Develop with IE
The tip refers to the Internet Explorer 10 in Windows 8.


