Pivot table - how to
Before you can create a Pivot table, you must enter your data. In this example, a sales Overview per quarter of a year. To do this, create a table in Excel with the columns year, quarter and sales revenue, in million Swiss francs (see graph).
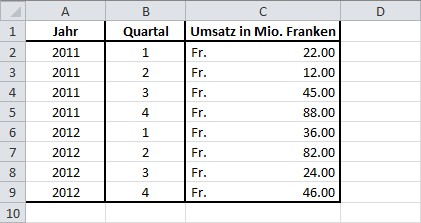
Data of the Pivot table
- Open the Tab "Insert" the "wizard" where you click on "PivotTable".
- Select the upper input field of the newly created table. Below select the Option "New worksheet" and confirm with a click on "OK".
- On the right side of the new sheet in the "PivotTable field list" select all of the columns: year, quarter and sales revenue.
- So the presentation makes sense, you need to move the fields "year" and "quarter" are still in the "row labels" (see graphic).

Options of the plot
The Pivot table is now ready. You can format them the normal. For example, you can define the column with the sales as a "currency" and the currency sign to add. The arrow in the column "year/quarter", you can also filter the data. Select the field "quarter" and the sales for the third quarter of each year.
They are Excel-Pro with the new rate in the CHIP Academy
With the course in the CHIP Academy "Excel: Pivot tables in less than an hour" to learn even for beginners, as it is quick and easy, even with a large amount of data to be bypassed.
- You will learn in 40 minutes from our lecturers Daniel Kogan, what Pivot tables are and how to use them wisely.
- You will learn how to draw by using Pivot-tables and Pivot-Charts, findings and insights from your data that would not have developed them otherwise.
- Visit the CHIP Academy and get it for 19,90 euros the extensive Video Workshop in the Online Stream.

CHIP Academy
The instructions are based on Excel 2010. Tip: Using the conditional formatting to highlight the values graphically.