X - and Y-axis swap the push of a button
- Select the chart by left clicking with the mouse. The ribbon should now appear in the new area "chart tools".
- Now click on the Tab "design" and then click the Button "row/column switch".
- After you have changed the view should look like the diagram something like that shown in the second graph.
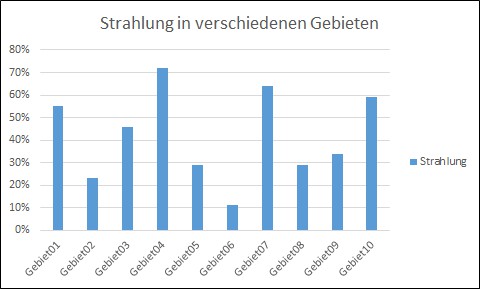
Chart before the change
After you have changed the view should look like the diagram something like that shown in the second graph.
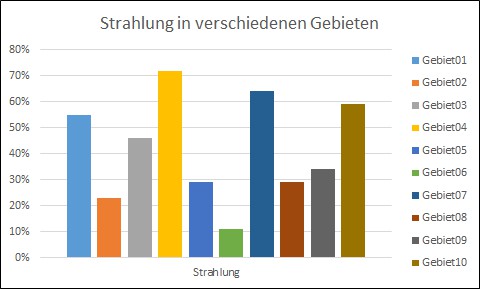
Chart after the change
These instructions apply to Excel 2013. As rows to columns and Vice versa converts, you will find: rows/columns to convert