Data table for growth curve create
The growth curve represents the ratio of the size at the time. Therefore, you need two variables: size and time.
- So you can create a chart, you need first of all a table with data. The can look like that in the first column the time, and in column two the corresponding size listed is.
- You want to display, for example, the growth of your dog, measure him daily over a period of time.
- Then, you enter the days in the first column and the values in the corresponding column B (see image 1).
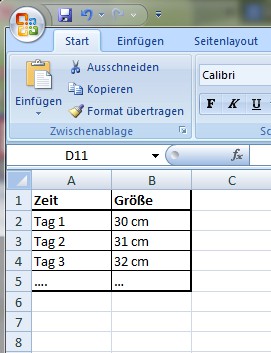
Figure 1: table with data fill
Growth curve in Excel
- Select all the areas of the table that you want to include in the chart. That is to say: if you want to have displayed all values, use the mouse to highlight the entire table including the header row.
- If you have selected the entire table, click in the menu bar, click "Insert". Here you can select different chart types. For a growth-curve using ideal a line chart.
- So click under the menu item "Insert" on the chart type "line" and select one of the listed forms of representation (see figure 2).
- You click on one of the line charts, you can see it on the screen. It is but now still not absolutely finished: Excel has opened up in the menu automatically bar the tab "design". Here, you can make your growth curve individually.
- Finally, you can format by right-clicking on the chart and then clicking on "chart area", other settings on your chart and change the look.
Tip: line charts are best suited to growth curves represent.

Figure 2: Line Chart
Practice tip applies to Excel 2007.