Charts in Google Docs to create
To create in Google Docs charts, you need to summarize your data in a table. Here's how:
- Log in to Google Docs or Google Drive.
- Click in the menu on top "Add-ons" > "Add-ons" screen.
- Are you looking for in the search bar to search for "Charts".
- Add the extension "Charts" from the list and click "Free" at the end of a line.
- In your document, again select "Add-ons" and click in the context menu and "Charts" > "Open Chart Builder".
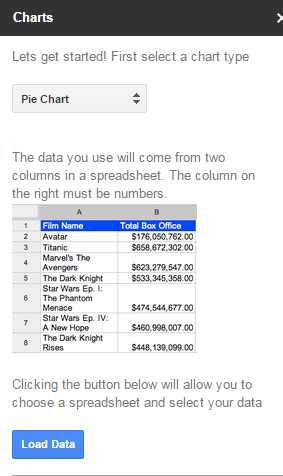
- On the right side, you can select which type of chart to be created.
- You need to have your data in a table, wherein the right-hand column of Figures should be included.
- Click on "Load Data" and select your table document.
GDrive: creating charts
As DOCX files with Google Docs openwill give you another practical tip.


